Who eats whom: a 3D map of the Mediterranean
If people eat clams in Spain, can that cause a collapse of the sea bream population in the Adriatic? Network science applied to marine food webs.
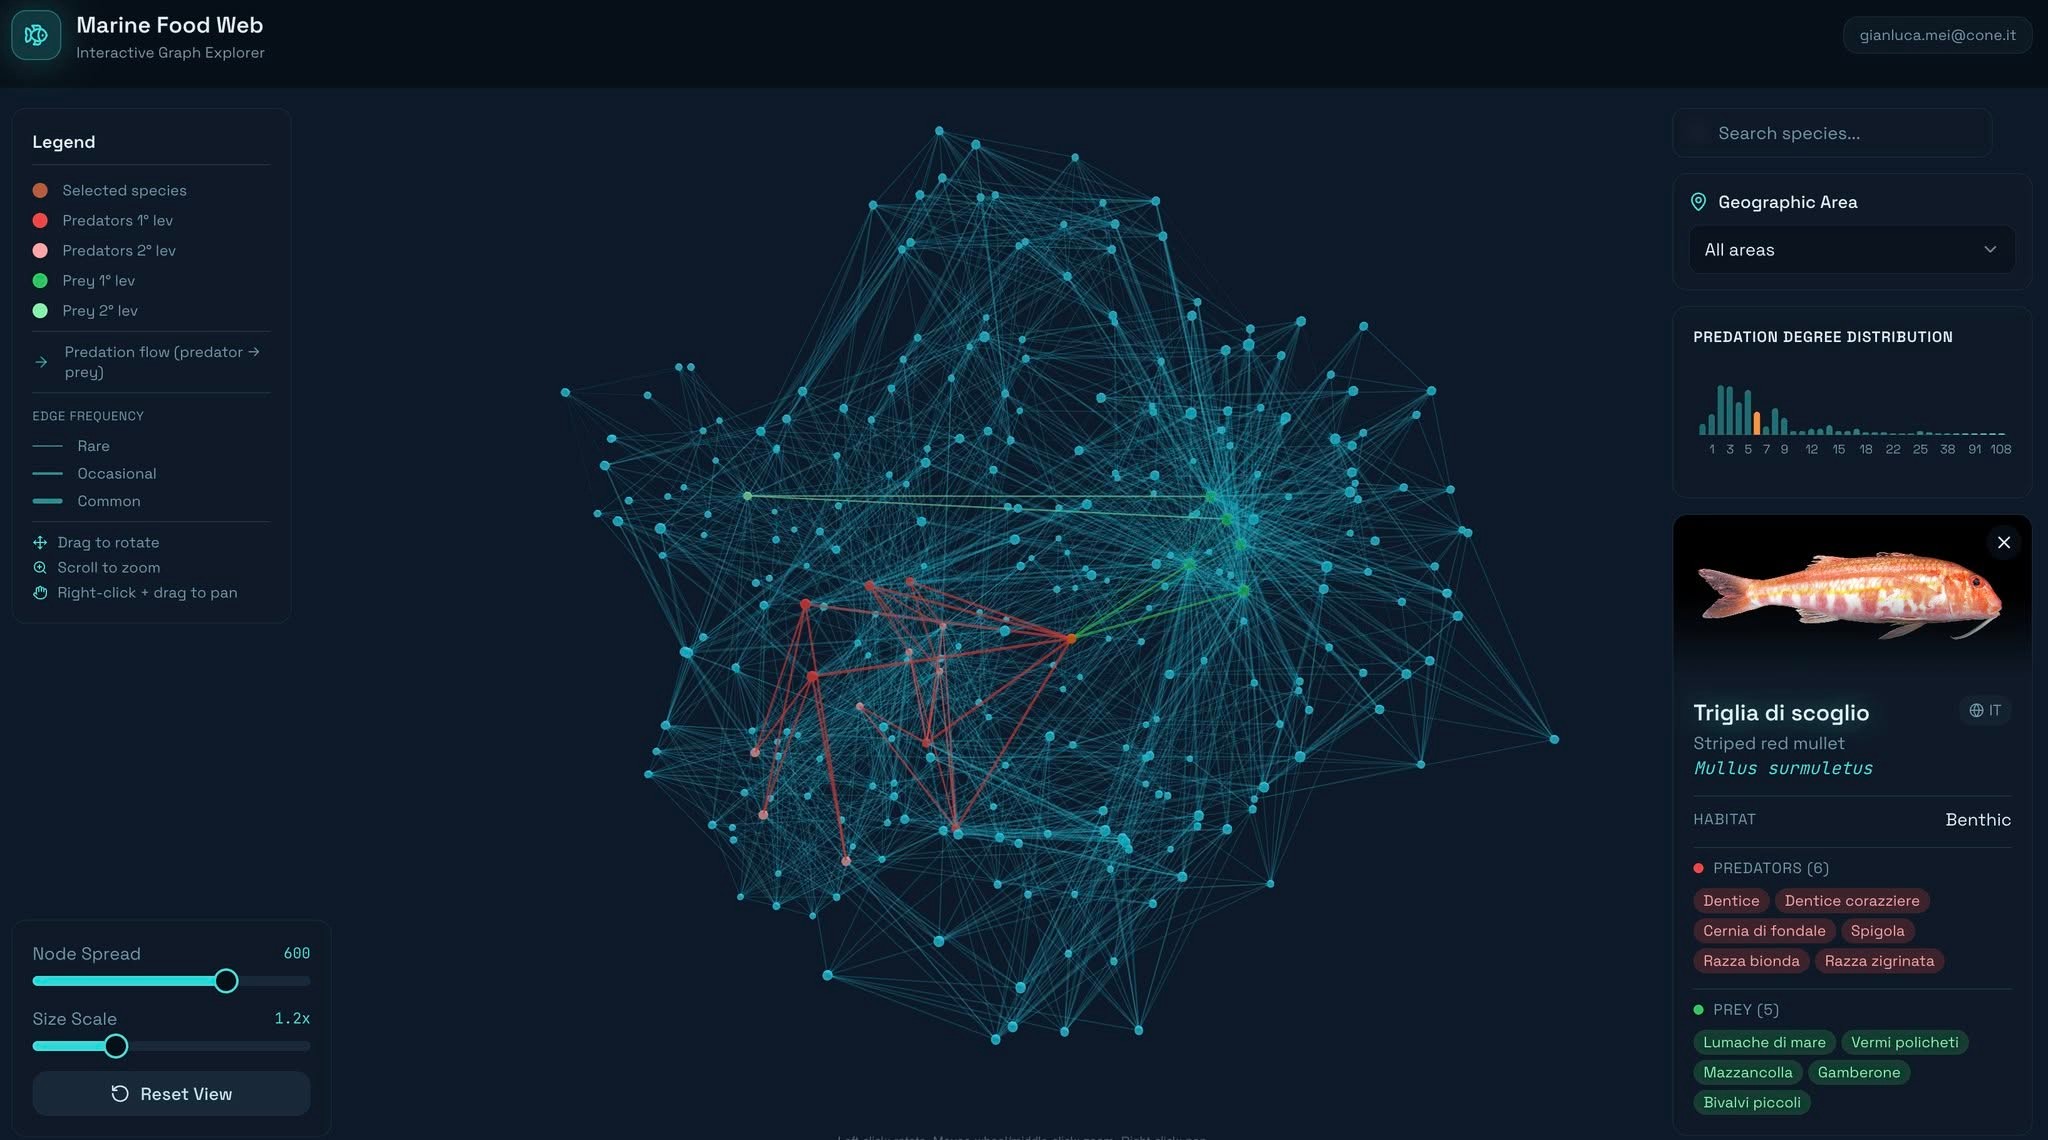
Probably not. But in general, food webs, unlike food chains, bring out the intricate predation relationships between the different species of an ecosystem.
So we got curious and created an exploratory, interactive 3D tool to map the food web of Mediterranean marine species (or others, depending on the datasets available).
The tool is published here: https://marinegraph.kealab.co/ Note: for now it uses a simulated dataset with heuristic rules. We are looking for real, validated and linkable datasets.
Each node represents a species and the relationships represent predation. By clicking on a species you can see its prey and predators, both direct and indirect.
The tool computes some network science metrics, such as the degree distribution, and can be useful for visualising and exploring delicate interdependencies.
For example, a drop in the availability of one species could lead to greater predation pressure on another that shares its predator, which might turn its attention to a fourth species apparently unrelated to the first. These are relationships known and studied for individual species, but not always easy to grasp as a whole. In the tool, they are four coloured segments between nodes.
The experimentation goes on. If you have data available, write to us!